

Letter to Nature
- Oct 9, 2020
- 2 min read
Updated: Oct 22, 2020
Dear Editors,
“Arctic sea ice hits second-lowest level on record” by Witze attributes the Arctic ice melt to warm air from remote Siberia. I disagree. Instead, I believe that this is due to earthquake vapor. My arguments are as follows.

Arctic ice image form “Arctic sea ice hits second-lowest level on record” (Nature, 22 Sept 2020).
In the image provided by the article, a T-shaped dark crack (‘MNOP’) was under deep water in an iceberg. A narrow crevice (e.g. ‘de’) was in a block of almost separated ice. This is difficult to explain based on warm air from Siberia for two reasons. First, warm air always rises up. How can it create the T-shaped crack in deep water? Second, warm air from Siberia must have a large volume. How could it make the narrow crevice?
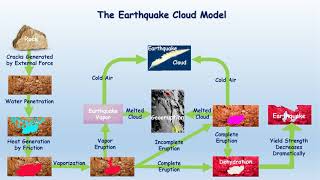
My Earthquake Vapor theory can explain this. In my theory, when a huge rock is stressed by external (including man-made) forces, its weak parts break first. This induces the formation of crevices into which ground water percolates. Water expansion, contraction, friction and erosion further weaken the rock. Friction during ground movement heats the ground water and eventually generates vapor at high temperature (300~1520oC)1 and high pressure (67055~96000 atm)2. This vapor erupts from an impending hypocenter to the surface by crevices and nozzles, and rises up. The vapor can form an “earthquake cloud” when encountering cold temperature at a higher altitude, or a geoeruption (geothermal eruption) as its heat dissipates a preexisting cloud. Afterward, an earthquake happens within 112 days according to the 509 events I have analyzed.
Using the earthquake cloud theory, I successfully predicted many earthquakes, including the Bam, Iran earthquake in 2003. A cloud appeared from and persisted at a nozzle in Bam, Iran for 26 hours on 20~21 Dec 2003 when surface temperature increased 5oC downwind. Based on this cloud, I predicted an earthquake of magnitude 5.5 or above within 60 days at the vapor source to the public at UTC 0:58 on 25 Dec. An M6.8 earthquake hit Bam on 26 Dec, and was the only one in the predicted area and magnitude in the historical record of about 3000 years1.
Now, let’s account for how the big T and crevices formed on ice. A swarm of six moderate quakes happened in “85o north” in 2020. The largest was a magnitude 5.3 quake at north of Svalbard (N87.37, E7.55) on 5 Aug 2020. Many small quakes accompanied. They together formed a main line with branches, where heat rose up by convection and vapor eruption to melt ice above, so the T-shaped crack formed. Crack NP is younger and smaller than Crack MNO, so “de” is narrow above NP and has not completely separated the ice yet.
Clouds in between x and o, and at y and z look like earthquake clouds, but need more satellite images before and after to make sure. If possible, hope you will offer me the time, coordinate and website of the satellite image.
Sincerely,
Zhonghao Shou
Reference:
1 Harrington, D., and Shou, Z. (2005). Bam Earthquake Prediction & Space Technology
Seminars of the United Nations Programme on Space Applications (United Nations) 16. 39–63.
2 Shou, Z and Fang Y (2016). Earthquake Vapor Model and Precise Prediction (ed. Shou, W. Amazon in English, and ed. Yao, W. Tianjin Univ. in Chinese 2018).


Comments